

An important part of vPlan is the time registration. To keep track of how much time is registered, we have the dashboard time tracking. Read all about the dashboard and how to use it in this article.
Overview
When you go to the dashboard via the menu on the left, you will see the following overview.
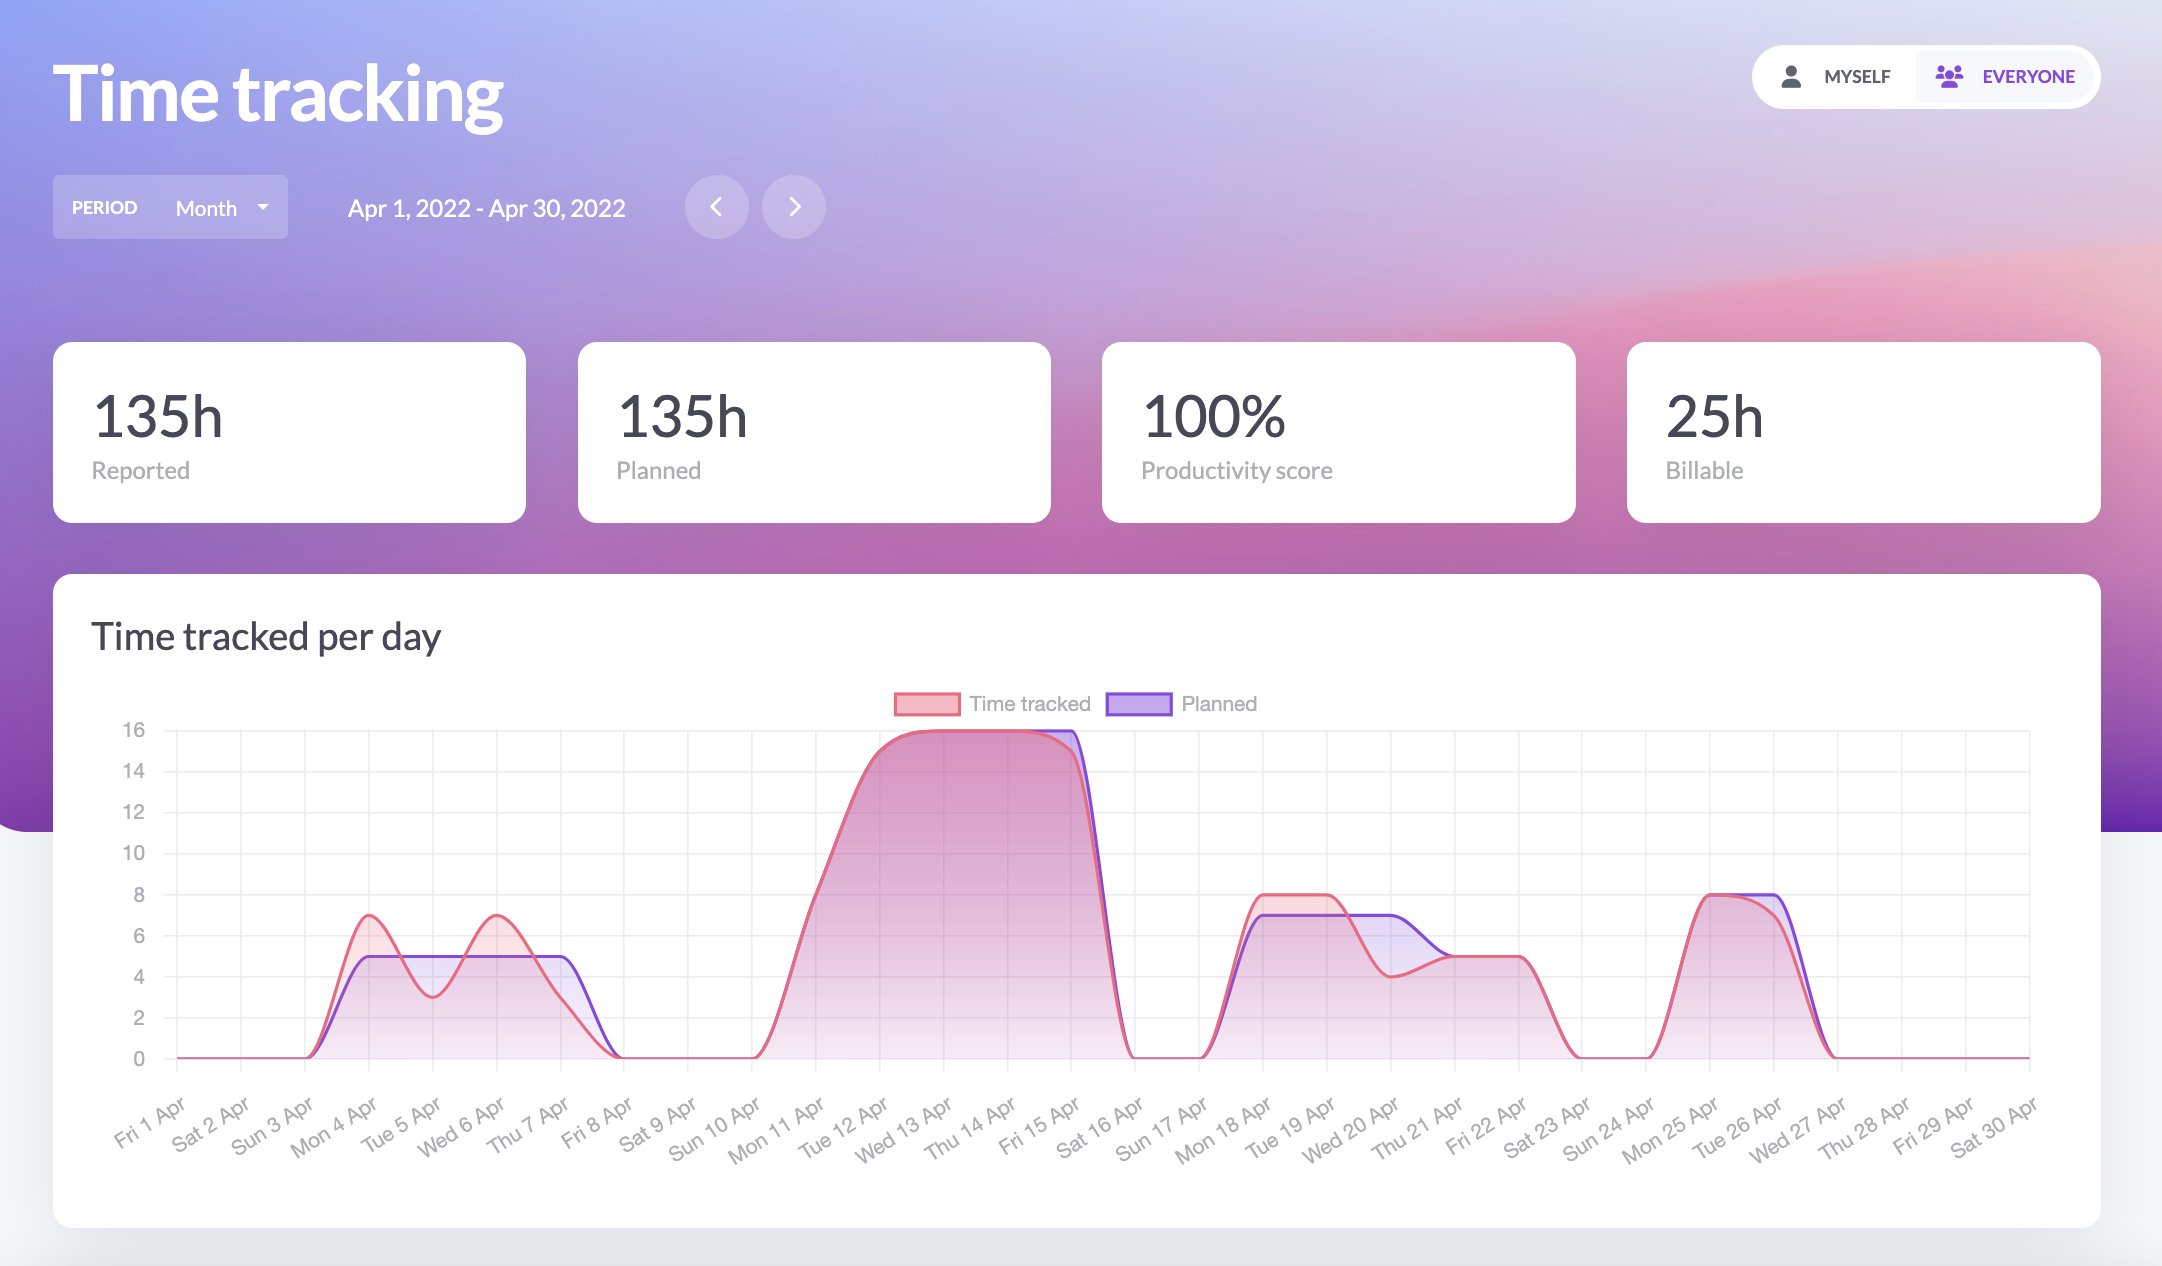
In this overview you see four blocks with the registered time, the scheduled time, the productivity score and billable hours. These blocks provide quick insight into the number of hours that you have registered and planned. When the productivity score is at 100%, it means that you have actually done the planned work in the time that was estimated for it. When this is higher than 100% you needed fewer hours than was calculated, and when this percentage is lower than 100% you needed more hours than estimated beforehand. The last block shows how much of the total number of planned hours can be billed.
Below that you see a graph with the time tracked per day. This graph compares the registered time and the planned time, so that you quickly gain insight into how many hours are planned and when time has actually been registered.
At the top right you can select whether you want to see the registered time of all users, or only the time that you have registered yourself.
Adjust period
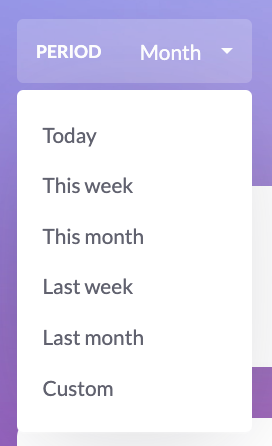
The time registration dashboard shows the data arising from the registered time. The time registration can be displayed for the following periods: today, this week, this month, last week, last month and other; where you can manually select a period by clicking on the date. At the top left you can choose the desired period, as you can see in the image below.
Columns
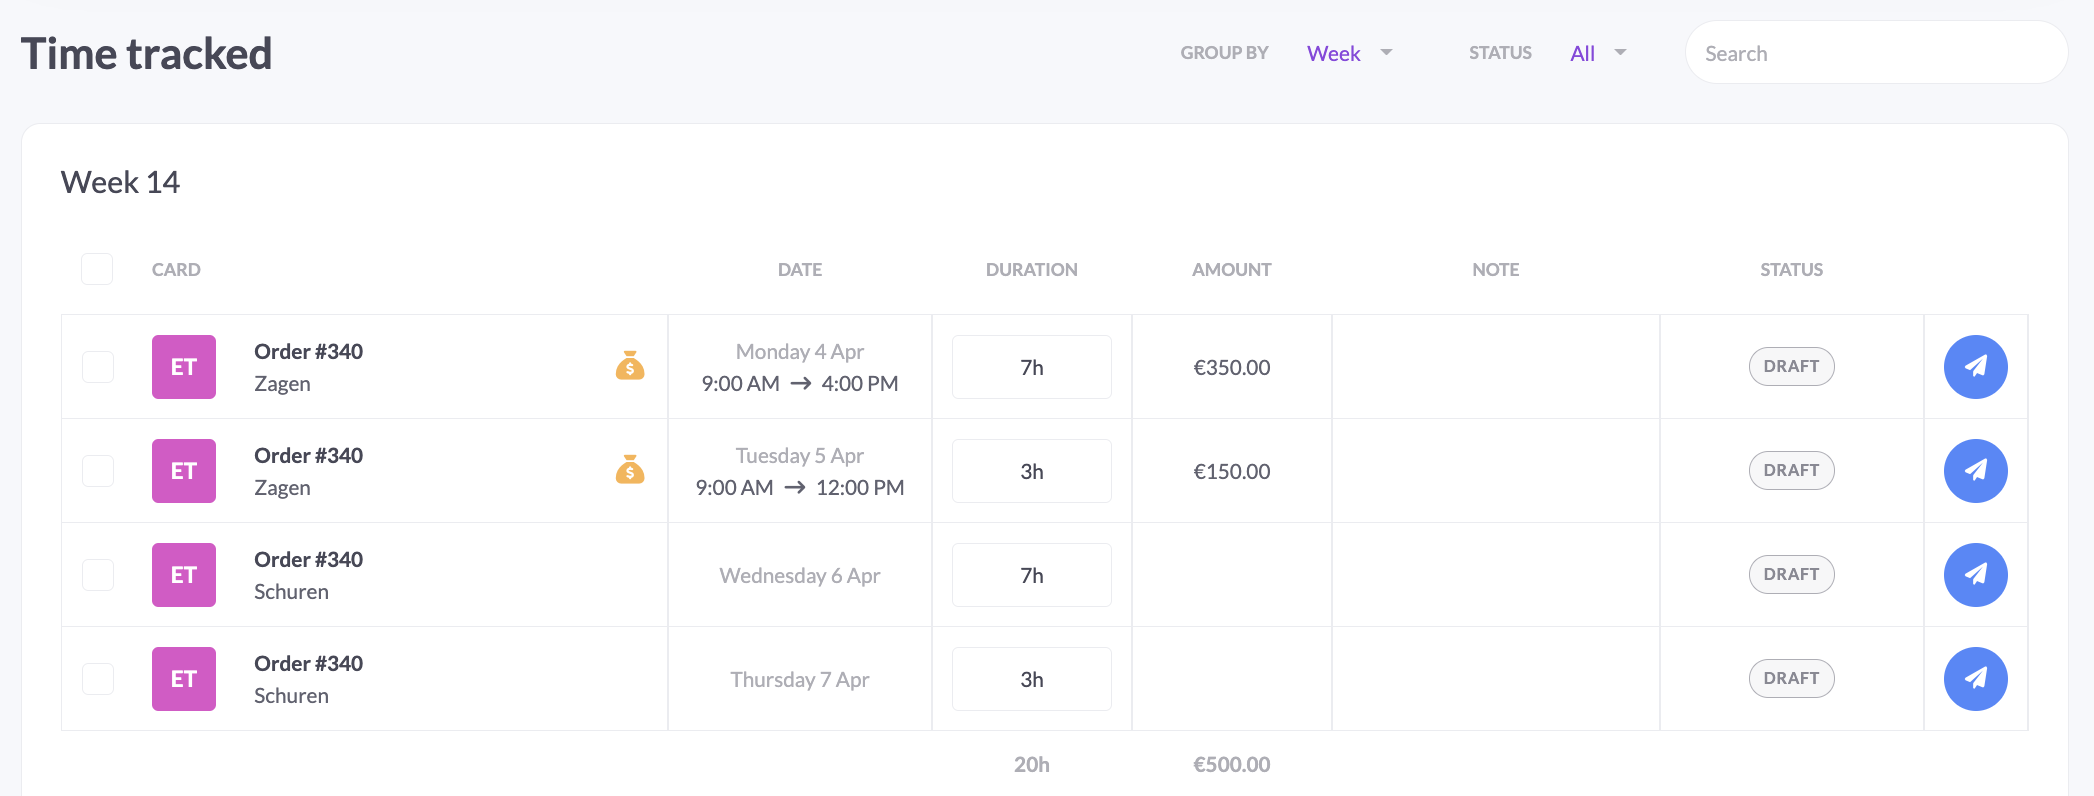
In the dashboard you will see different columns for the registered time. These are the columns card, date, duration, amount, note and status.
 Card
Card
The first column in the time tracked overview is the card. Here you can see which order or project it concerns, which activity belongs to it and by which user the time was registered.
Date
In the date column it becomes clear on which day the time was recorded and what the start and end time of the tracked time is.
Duration
The time duration shows how many hours have been registered on a particular activity.
Amount
The amount column provides insight into the amount to be invoiced. When you add an activity you can indicate whether it is billable or not, and what the corresponding hourly rate is. In the dashboard, vPlan calculates the total amount to be invoiced based on the tracked hours.
Note
When time is registered, a note can be added. This can be found in the notes column.
Status
When registering time, there are different statuses, these can be found in the last column. How these statuses work is further elaborated later in this article.
Group by
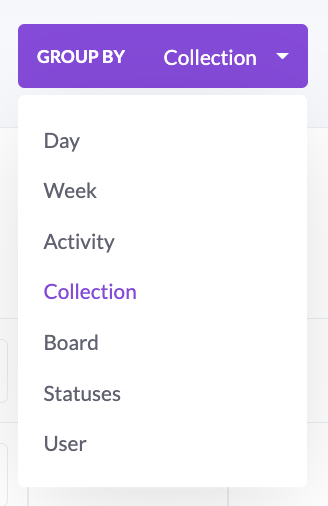
The registered time can be grouped. This way you can see the recorded time per day, week, activity, collection, planning board, statuses or user. At the top right you can choose the desired grouping, as you can see in the image below.
Statuses
Within the time registration there are different statuses, namely draft, pending, approved, rejected and ongoing. These statuses are editable for administrators or planners, employees can only submit their written time.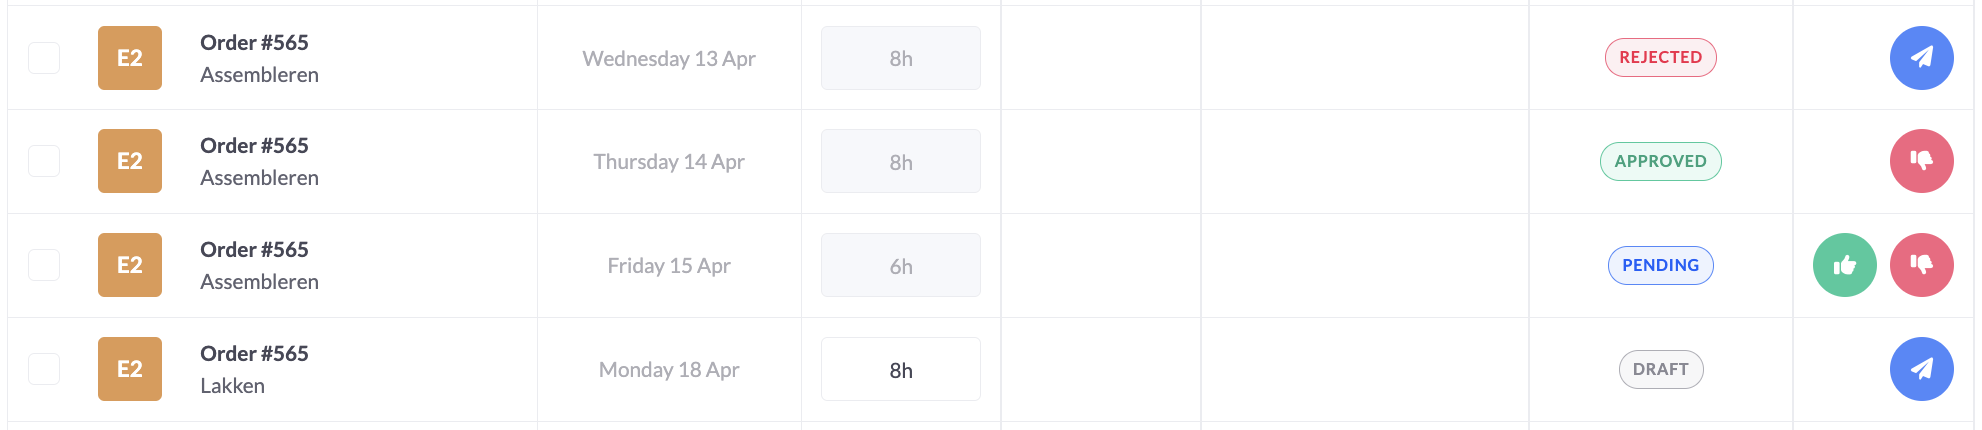
An employee can submit his or her registered hours by clicking on the blue arrow. An administrator or planner can then approve or reject them by selecting the green or red thumb. When a registration has been rejected you will see the blue arrow appear again, the time can now be resubmitted.
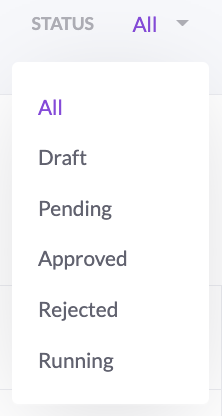
You can also filter by status to only view time registrations with a certain status. At the top right you can choose the desired status, as you can see in the image below.
Check boxes
The checkboxes at the front of the line allow you to check multiple time registrations at the same time. In this way you can submit all or a number of selected time registrations at the same time.